Your Chemical Supplier Is Absorbing a 38% Tariff.
Are You Still Paying Last Year's Price?
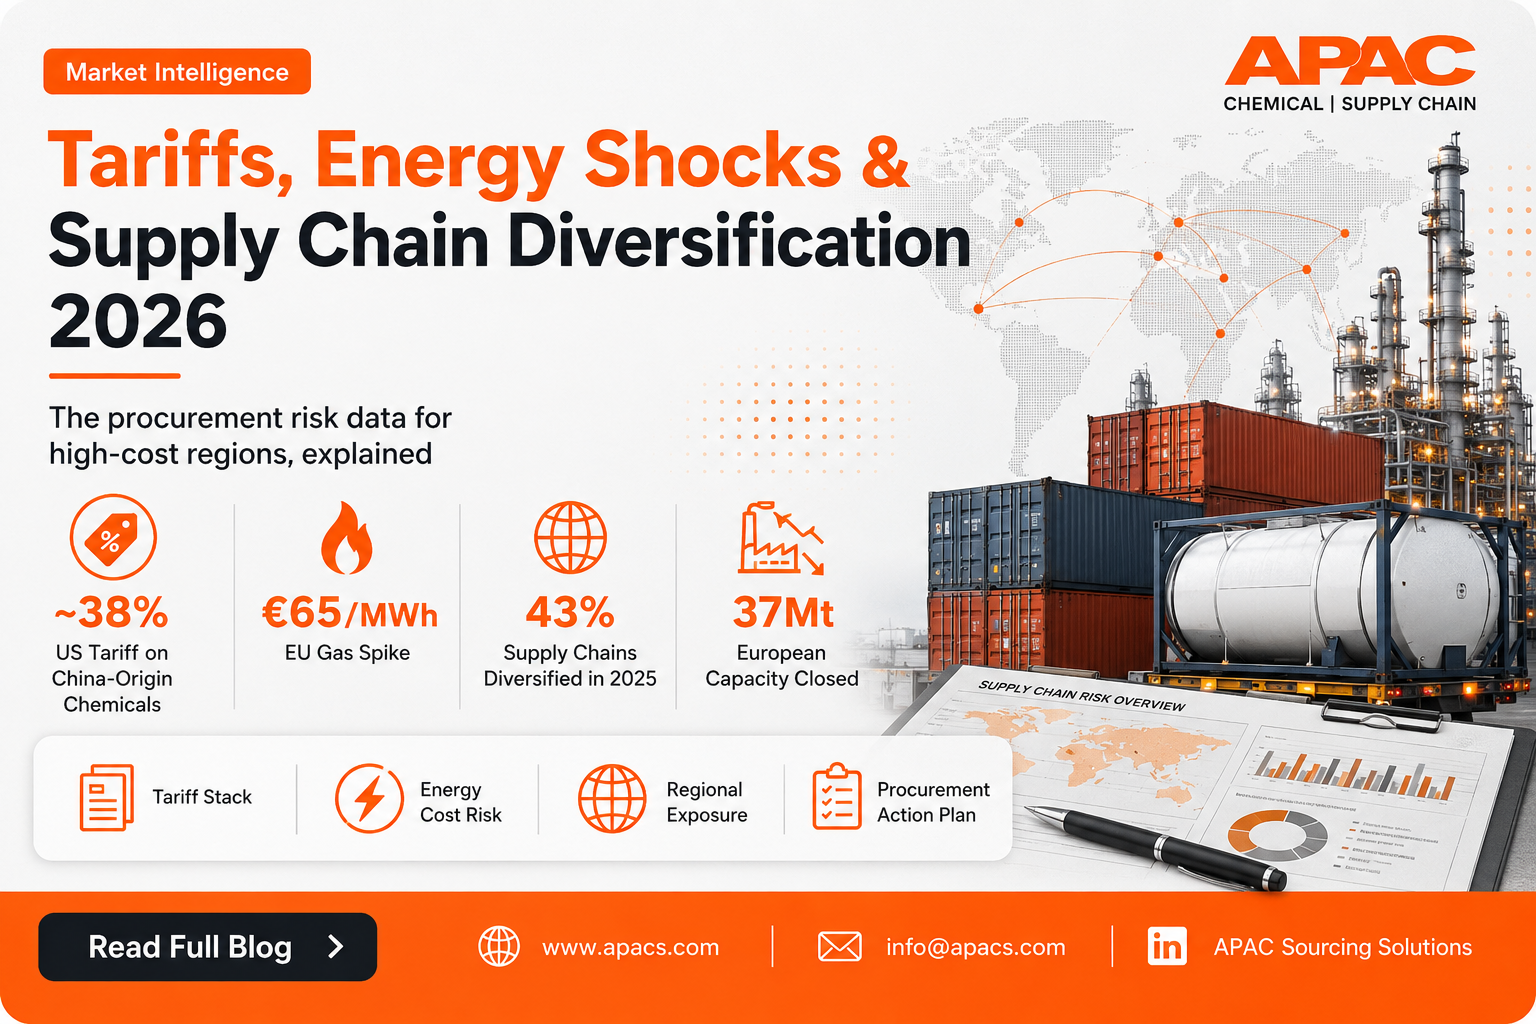
⚡ What changed while you weren't looking: Three forces collided in the first half of 2026 — a ~38% combined US tariff on Chinese-origin chemical imports, a European gas price that swung from €27 to €65/MWh in five weeks, and 43% of global supply chains shifting sourcing location in 2025 alone. None of this is a forecast. The question is whether your sourcing strategy has kept pace.
In brief: This guide connects three procurement signals that are usually reported as separate stories: layered US tariffs stacking to roughly 38% on Chinese-origin chemicals, a European energy shock that drove natural gas from €27 to €65/MWh and closed 37 million tonnes of Western chemical capacity since 2022, and measurable, data-backed supply chain diversification now underway at scale across APAC. Together, they describe a single underlying shift: the cost of sourcing concentration has risen — and risen faster than most annual procurement reviews can respond to. This guide gives you the verified data, the regional breakdown, and a five-step action plan.
1. The Moment Procurement Teams Are Actually In Right Now
Most procurement disruptions arrive quietly. A supplier mentions "cost pressures." A contract comes up for renewal at a higher number than expected. A shipment lands with a customs surprise nobody budgeted for.
What's different about 2026 is the speed and the simultaneity. Three forces that procurement teams usually manage in sequence are moving at the same time — and they are compounding each other rather than offsetting.
The key point: Every data point in this guide describes something that has already happened in the first half of 2026 — not a forecast. Procurement teams reading this are not ahead of the curve. The open question is whether their sourcing flexibility is in place before the next number moves.
2. The Tariff Stack: What You're Actually Paying on Chinese-Origin Chemicals
The most common mistake in tariff analysis is treating it as a single rate. In 2026, US chemical tariffs are not a number — they are layers, and those layers add differently depending on where the product originated. Here is what the stack looks like for the three most important origin categories.
| Origin / Tariff Layer | Rate | Notes |
|---|---|---|
| Base HTS rate (chemicals, HTS 28–38) | 3% | Applies broadly across most chemical import categories |
| Section 122 (global emergency tariff) | 10% | Effective Feb 24, 2026; applies uniformly to nearly all exporting countries; scheduled to expire ~Jul 24, 2026 unless extended by Congress |
| Section 301 (China-specific surcharge) | 25% | Remained in force after the Supreme Court's February 2026 tariff ruling |
| Combined — China-origin chemicals | ~38% | Sum of base + Section 122 + Section 301 — the most heavily penalised origin in the market |
| Combined — Germany / EU-origin chemicals | ~13% | Base + Section 122 only; reduced from a prior 20%+ IEEPA reciprocal rate |
| Canada / Mexico (USMCA-qualifying) | 0% | Duty-free if rules-of-origin are met — roughly a 13-percentage-point advantage over non-USMCA sourcing |
The live risk most contracts are missing: The 10% Section 122 layer is explicitly time-bound and set to expire around July 24, 2026 — unless Congress acts to extend it. That means procurement teams are currently pricing contracts against a tariff structure that could legally change mid-agreement. Chemical trade groups have pushed for predictable trade policy, but as of mid-2026 that predictability has not materialised. Contracts without explicit tariff pass-through clauses are absorbing this uncertainty by default.
Section 301 alone (25%) was the primary China tariff concern. Procurement teams could model this as a stable, known cost.
Three layers now stack (3% + 10% + 25% = ~38%) and one of those layers is a live legislative variable with a July sunset date. The math changes quarterly.
3. Europe's Energy Trap: When Plant Closures Aren't a Forecast Anymore
If tariffs are the visible procurement risk in 2026, energy cost is the structural one. For buyers using European-origin chemical inputs, the risk is not a future event — it is already showing up in the form of real capacity that no longer exists.
| Period | TTF Price Range | Context |
|---|---|---|
| January–February 2026 | €27–32/MWh | Range-bound trading, broadly in line with late 2024 levels |
| Early March 2026 | €60–65/MWh | Sharp spike triggered by supply disruption concerns and Gulf shipping risk |
| Mid-June 2026 | ~€42–44/MWh | Partial easing after a preliminary US–Iran framework reduced geopolitical pressure on shipping routes |
According to the European Chemical Industry Council (Cefic), European natural gas prices averaged roughly 2.5 times US prices through 2025 — and that structural gap, not just the March spike, is what is driving closures. Between 2022 and 2025, Europe lost 37 million tonnes of chemical production capacity, roughly 9% of the continent's total, with approximately 20,000 direct jobs lost and another 89,000 indirect jobs estimated at risk. Energy cost was cited as the primary reason in roughly half of all closure announcements — well ahead of weak demand (19%), overcapacity (9%), or regulatory factors (8%).
| Country | Capacity Closed (Mt) | Share of Total |
|---|---|---|
| Germany | 8.8 Mt | ~25% |
| Netherlands | 7.2 Mt | ~20% |
| United Kingdom | 4.5 Mt | — |
| France | 3.9 Mt | — |
| Italy | 2.5 Mt | — |
| Belgium | 2.3 Mt | — |
| Spain | 1.6 Mt | — |
The investment data tells the same story from the other direction: confirmed new chemical capacity investment in Europe fell from roughly 2.7 million tonnes in 2022 to just 0.3 million tonnes in 2025 — an 86% decline in four years. Europe's share of global chemical sales has fallen from 27% in 2004 to 13% in 2024, while China's share rose from 10% to 46% over the same period.
The harder truth: This is not a temporary price spike that will self-correct. Cefic's own language — that closures are "accelerating, not slowing" — points to a durable structural disadvantage. For buyers, European-origin supply is exposed to ongoing capacity risk independent of any single gas-price event. That is a different, longer-duration risk than a tariff with a printed sunset date.
4. The Diversification Shift: Data, Not Just a Trend
China+1 has been discussed as a strategy for nearly a decade. What changed in 2025–2026 is the scale at which it is actually being executed — and the data now backs up what was previously mostly anecdotal from procurement conferences.
Why this matters for chemical procurement specifically: Over 90% of US- and China-based supply networks reported being heavily affected by tariffs in 2025 (QIMA). Chemical inputs sit at the base of most industrial supply chains, which means tariff impact here multiplies across every downstream product. The teams that diversified sourcing before 2025 entered 2026 with options. The teams that didn't are now qualifying alternatives under time pressure — the most expensive way to do it.
5. Why These Three Risks Should Be Read as One
Treated separately, tariffs, energy costs and supplier consolidation look like three unrelated stories assigned to three different teams — trade policy, energy procurement, and strategic sourcing. Treated together, they describe a single underlying shift: the cost of staying concentrated in one supplier, one region, or one energy cost profile has risen, and risen on a timeline measured in weeks, not planning cycles.
The Olin–Huntsman merger is a live example of the fourth compounding force. Announced June 16, 2026, this $12B+ combination creates one of North America's largest integrated chemical companies. Mergers of this scale don't change tariff rates or gas prices — but they do change supply allocation priorities, product rationalisation decisions, and negotiating leverage for buyers who had relied on either producer independently — arriving at exactly the moment those buyers are already absorbing tariff and energy cost shocks elsewhere in their portfolio.
The structural read: Procurement teams that manage tariffs, energy exposure and supplier concentration on separate review cycles will consistently underestimate combined risk. A supplier that looks resilient on a tariff basis may be exposed on an energy-cost basis — or vice versa. The more useful unit of analysis in 2026 is total concentration risk per critical input, measuring supplier, region and energy source together — not any single category in isolation.
6. Regional Exposure Map: USA, Canada & Europe vs Asia
Tariff exposure and energy exposure do not move together, which means the right sourcing response differs by region. The table below summarises the net procurement position for the three markets most directly affected by the forces described above.
| Region | Tariff Exposure | Energy Cost Exposure | Net Procurement Position |
|---|---|---|---|
| United States | Imposes tariffs on non-USMCA imports; importers of Chinese-origin chemicals absorb the ~38% combined rate | Comparatively low — domestic Henry Hub gas trades well below European TTF benchmarks | Energy-cost advantaged domestically; tariff complexity is the dominant risk for imported chemical inputs |
| Canada & Mexico | Largely insulated via USMCA duty-free treatment for qualifying rules-of-origin products | Low to moderate, broadly aligned with North American benchmarks | Structurally favoured sourcing origin for US-bound buyers — if rules-of-origin qualification can be confirmed |
| Europe | Moderate on US-bound exports — 13% combined (base + Section 122 only), down from prior reciprocal rates | High — ~2.5x US prices through 2025; actively driving chemical plant closures across Germany, Netherlands and UK | Tariff-light but structurally energy-cost disadvantaged; capacity availability risk is rising independent of any tariff outcome |
The practical implication: a sourcing strategy optimised purely for tariff exposure might lean toward European suppliers — but that ignores the energy-driven capacity risk documented in Section 3. A strategy optimised purely for cost might concentrate in Asia — but that layers in the China-specific tariff exposure. The position with the best risk-adjusted outcome, in most cases, is a deliberately diversified supplier base spanning multiple regions and energy-cost profiles.
7. Where Buyers Are Actually Moving To
Most procurement teams are not picking a single replacement for Chinese-origin or energy-exposed European supply — they are building multi-country portfolios. Here is how the most commonly cited alternative sourcing destinations compare for chemical and industrial inputs.
- Leading destination for China+1 volume shifts
- Established light manufacturing base
- Lower labour cost than China
- Chemical/industrial infrastructure still maturing
- Large, fast-growing domestic chemical sector
- Government-backed production incentives
- Significant cost advantage at scale
- Compliance variability by state requires verification
- 0% duty into the US under USMCA
- Nearshoring logistics advantage
- Strong for time-sensitive industrial inputs
- Rules-of-origin compliance is the qualification hurdle
- Strong specialty chemicals ecosystem
- English-proficient, multilingual business environment
- ISSB-aligned sustainability reporting from 2025
- Scale limits vs India or China for bulk volumes
- Lower labour cost than Western Europe
- Suitable for less energy-intensive inputs
- Still exposed to broader European energy cost gap
- Logistics advantage for EU-bound buyers
- ~27–30% of global manufacturing output
- Unmatched industrial ecosystem depth and scale
- Highest combined US tariff layer (~38%)
- China+1 strategies retain China, not replace it
What "verified" actually means here: A supplier's country of origin is not sufficient for USMCA qualification or compliance with APAC sustainability reporting frameworks. Documentation — Certificates of Analysis, Certificates of Origin, SDS/TDS packages — determines whether a supplier is actually usable under time pressure. A technically capable supplier with incomplete paperwork is not a real alternative when speed matters. This is the most common gap in China+1 execution.
8. Five Actions for Procurement Teams Right Now
The data points to a consistent set of actions regardless of which specific inputs a procurement team is managing. These are not strategic principles — they are operational steps that can be started in Q3 2026.
9. How APAC Sourcing Solutions Helps
APAC Sourcing Solutions works with procurement teams in chemicals, packaging and industrial materials to build exactly the kind of sourcing flexibility this guide describes — before a tariff change or energy shock forces the issue. We hold ISO 9001:2015 certification and an EcoVadis Sustainability Rating, independently assessed — because your supplier's credentials matter as much as their price.
Reviewing Your Sourcing Strategy for H2 2026?
We help chemical, packaging and industrial buyers build verified alternative sourcing options across APAC — before the next tariff change or energy shock makes it urgent.
Email Our Team Visit apacss.com10. Frequently Asked Questions
Three forces are colliding simultaneously: layered US tariffs that push combined duties on Chinese-origin chemical imports to roughly 38%, a European natural gas price shock that spiked to €60–65/MWh in March 2026 and has driven a wave of real plant closures, and an acceleration in supply chain diversification as buyers respond to both. Individually each is a known risk category; together they represent a structural increase in the cost of single-source, single-region dependency.
For Chinese-origin chemicals entering the US, three tariff layers stack: a 3% base HTS rate, a 10% Section 122 tariff effective from February 24, 2026 (applying uniformly across nearly all exporting countries), and a 25% Section 301 surcharge specific to China. Combined, that is approximately 38%. EU/German-origin chemicals face roughly 13% (base + Section 122 only), while Canada- and Mexico-origin chemicals qualifying under USMCA rules of origin enter duty-free.
European TTF natural gas prices traded at €27–32/MWh through January–February 2026, then spiked to €60–65/MWh in early March amid supply disruption concerns, before easing to roughly €42–44/MWh by mid-June 2026. Per Cefic, European gas prices averaged roughly 2.5 times US prices through 2025 — and energy cost competitiveness is cited as the primary reason in roughly half of the 37 million tonnes of European chemical capacity closed between 2022 and 2025.
China+1 is a sourcing approach where a company retains its existing Chinese supply base while deliberately qualifying and activating at least one additional sourcing location elsewhere — typically Vietnam, India, Mexico or Eastern Europe — to reduce geographic and tariff concentration risk. Some companies have extended this into China+2 or China+3 multi-country sourcing portfolios rather than depending on a single alternative.
QIMA's 2026 Global Sourcing Survey of 1,000+ international businesses found 43% of supply chains shifted sourcing locations in 2025, with US firms leading at approximately two-thirds. Deloitte separately reports 57% of industrial manufacturers with China operations are implementing diversification strategies. McKinsey found 73% of respondents already leverage dual-sourcing for at least some inputs.
QIMA's 2026 data shows both: companies hit by tariffs were twice as likely to diversify, and those that diversified grew buying volumes by 39% versus 24% for companies that stayed with a single source. Diversification reduced risk and correlated with stronger commercial performance in the same dataset — though results vary by sector and execution quality, and correlation is not guaranteed causation.
The most commonly cited destinations are Vietnam, India, Malaysia and Southeast Asia more broadly, Mexico (with USMCA duty-free access for US buyers), and Eastern Europe. Each offers a different mix of cost position, existing chemical infrastructure, trade-agreement access, and documentation maturity. Most procurement teams are building multi-country portfolios rather than substituting China with a single replacement source.
Five actions: (1) map single-source exposure across every critical input; (2) pressure-test contracts against a tariff-and-energy stress scenario; (3) qualify at least one verified alternative supplier per critical input, even if not yet active; (4) score suppliers on documentation and export-readiness, not just price and capacity; (5) run the diversification math quarterly, not annually — tariff schedules and energy benchmarks are both moving on a multi-week cycle in 2026.
11. Conclusion: Flexibility Is the Strategy
Tariffs, energy shocks and supply chain diversification are usually covered as three separate procurement stories, assigned to three separate teams, reviewed on three separate annual cycles. The data from the first half of 2026 makes the case that this separation is the risk. These forces are not parallel — they are compounding. And together, they have raised the cost of sourcing concentration faster than most procurement planning processes are built to respond to.
The fundamentals are unambiguous: a roughly 38% combined tariff on Chinese-origin chemicals that could legally change structure in July 2026, a European energy cost base running 2.5 times US levels and actively closing real plants, and 43% of global supply chains that have already responded by diversifying. None of this is a prediction. For procurement and supply chain professionals in the US, Canada and Europe, the message is consistent across all three signals: the teams that built sourcing flexibility before the last shock had options when it landed. The teams building it now are doing so under more pressure and less time.
At APAC Sourcing Solutions, we work with buyers in chemicals, packaging and industrial materials to build that flexibility — through verified supplier networks, full documentation support and ongoing market intelligence. We hold ISO 9001:2015 and an EcoVadis Sustainability Rating, because the credibility of the sourcing partner matters as much as the sourcing strategy itself.
Don't Wait for the Next Shock to Start Diversifying
We help procurement teams build verified alternative sourcing options across APAC — with the documentation, export-readiness and market intelligence to make them actually usable.
Email Our Team Visit apacss.com

